


Twice Read Books: Nassim Taleb's "Fooled by Randomness" or, On Hidden Generators
On living with known and unknown probabilities

Recommended book:
Nassim Nicholas Taleb, Fooled by Randomness: The Hidden Role of Chance in Life and in the Markets (Second Edition)
I repeat the point: to philosophers operating in probability per se the problem seems one of calculus. In this book the problem of probability is largely a matter of knowledge, not of computation. I consider these computations a mere footnote to the subject. The real problem is: Where do we get the probability from? How do we change our beliefs? I have been working on the 'gambling with the wrong dice' problem: it is far more important to figure out what dice we are using when gambling than to develop sophisticated computations of outcomes and run the risk of having, say, a dice with nothings but 6s.
-Nassim Taleb, Fooled by Randomness
Order & Disorder, Order & Randomness
Is there a pattern or order in the image below?

How about this one?

And this one?
How about this one?

If we say that there is an order or pattern in Images 1 through 4, what we mean is that we can describe a way of drawing the image in relatively few steps - we can describe the pattern without describing every single feature (or, God forbid, pixel).
In a 10x10 grid:
[Image 1]: color each square red
[Image 2]: starting with the first row on top, color every other row red
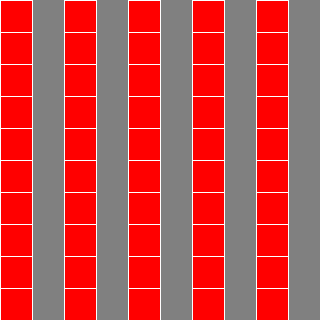
[Image 3]: starting with the first column on the left, color every other row red
[Image 4]: color each non-even numbered cell x (horizontal) and y (vertical) red (e.g. (1,1), (1,3), 1,5) Our minds see order in things that are easy to describe and/or reconstruct: if the territory is the image, the map in our minds is an instruction to reproduce it. You could easily, over the phone, describe any of these patterns using the steps listed above and have a friend reproduce it on graph paper. When you get together, unless you or they had made a mistake in description or transcription, you would have identical sheets. Think about describing to a friend how to drive to somewhere, starting from a location you both know.
What about Image 5? How would you describe it?

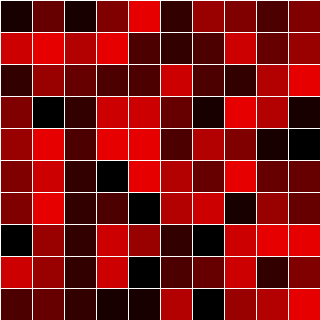
It is much more difficult to describe Image 5 succinctly. To a friend over the phone, you may have to describe each cell individually, going left-to-right for each row. You might use 1’s and 0’s.
[1 1 1 1 1 0 0 0 1 1]
[0 0 0 0 1 0 0 1 1 0]
[0 0 1 0 0 1 0 0 1 1]
[0 0 0 1 1 1 0 1 1 1]
[0 1 1 0 1 1 0 0 1 1]
[0 1 1 1 0 0 1 0 0 0]
[0 1 1 1 0 1 1 1 1 1]
[0 1 0 1 1 0 1 1 1 0]
[1 1 1 0 1 0 1 0 1 0]
[1 0 1 0 0 0 1 1 1 1]
What are the instructions for generating Image 5?
In a 10x10 grid:
     Go through each cell and flip a coin. If it comes up heads, make the cell red. If it comes up tails, leave it gray.
There’s a mismatch here between the generator of the output and the description of the output. In Images 1 through 4, the instructions to make the output and the concise description of the output are identical in length. In Image 5, the generating instructions are much simpler than the way to describe the output.
And finally, consider Image 6:
To describe it, you’d have to give the colour values of each cell. The image is not randomly generated, but you would be hard pressed to guess the rule on which it is based. Here’s the two-dimensional array it was made out of, with darker colours assigned to lower integers, and light colours assigned to higher ones:
[1, 4, 1, 5, 9, 2, 6, 5, 3, 5]
[8, 9, 7, 9, 3, 2, 3, 8, 4, 6]
[2, 6, 4, 3, 3, 8, 3, 2, 7, 9]
[5, 0, 2, 8, 8, 4, 1, 9, 7, 1]
[6, 9, 3, 9, 9, 3, 7, 5, 1, 0]
[5, 8, 2, 0, 9, 7, 4, 9, 4, 4]
[5, 9, 2, 3, 0, 7, 8, 1, 6, 4]
[0, 6, 2, 8, 6, 2, 0, 8, 9, 9]
[8, 6, 2, 8, 0, 3, 4, 8, 2, 5]
[3, 4, 2, 1, 1, 7, 0, 6, 7, 9]
The sharp-eyed will have spotted this is the first 100 decimal places of π arranged in a square 2-dimensional array. The instructions to render Image 6 are as follows:
In a 10x10 grid:
     Take the first 100 decimal places of Pi, and divide them into arrays of 10 in a 2-dimensional array
     For each cell of the grid, assign colors from black (0) to light red (9) based on the value of the corresponding cell in the array (e.g. in RGB, R values of 0 to 250, in increments of 25).
The generator is again simpler than the generated.
How would you describe what’s happening in the following graph?

If this were the price of a stock, you would want to tell a story about trouble at the company, news stories about issues with regulators, accounting troubles, with a rally just after the mid-point, but then a complete collapse at the end. The same if it were a population of an animal species in an ecological niche: the species struggled for Days 0 through 40, but pulled off an enormous rally from Day 40 through Day 60, possibly because they found a bunch of food. Then there was a huge collapse towards the end, possibly because they multiplied beyond their food supply.
Then consider Image 8:

Here we can tell a story about struggle but continual upward ascent. If you put a linear regression on this chart’s data points, it would have an (overall) upward slope. There’s trouble near the end of the series, close to Day 100, but we have reason to be optimistic. The storytelling impulse is difficult to resist, and largely unconscious. If this were a stock, you’d be able to find news stories to back up your interpretation. In fact, the interpretation of the stock or bond or Treasury movement would already be supplied for you, so you wouldn’t have to make up your own story.
As an aside, something about time-based presentations triggers our story-telling faculties. Its hard to look at a time series of data and not try to ascribe a meaning to it, the same way its hard to hear “the king died, and the queen died” without wanting to modify it to “the king died, and then the queen died of grief.”
Now I reveal what you’ve probably suspected: Images 6 and 7 are random. Specifically, they are one-dimensional Brownian motion: starting at 50, at each interval/day, the value can move up 5 points or down 5 points (a “step”), or it can stay the same. Each outcome has a 1/3 probability. In fact, the two graphs were generated by the exact same Python code, run twice:
import numpy as np
from random import randint

start = 50
stepsize = 5
walkarray = np.zeros(100)
walkarray[0] = start
for i in range(1,len(walkarray)):
    previous = walkarray[i-1]
    step = randint(0,2)
    if step == 0:
        newstep = previous
    elif step == 1:
        newstep = previous - stepsize
    elif step == 2:
        newstep = previous + stepsize
    walkarray[i] = newstep
    previous = newstep

# plus some graphics plugin jazz that I have left out to save space
Generators need not be so simple. In the case of real Brownian motion, the random three-dimensional path of a microscopic grain of dust or pollen in clear water, countless molecules moving on a huge number of paths are interacting with the dust mote to make the motion happen. At one moment, their collective impacts sum to a certain vector (for an x-y-z coordinate system, perhaps [3,4,2]) then sum in the next moment to another vector (perhaps [-2,4,-5]).
The generators we make to simulate such motions are vast simplifications of the real-world phenomenon. The problem is, as Nassim Taleb relates at length in Fooled by Randomness, we too often forget this. Our ability to tell stories about the world spots real patterns and can make, in many cases, accurate-enough-to-stay-alive-and-thrive predictions, but the same ability can make us fail to see genuine randomness, the Brownian motion at work in the world’s many interacting systems. Even a set of strictly deterministic systems interacting can create essentially random outcomes.1 We see order where there is none to be found, or we substitute a simpler, easier to remember, easier to communicate order for what is actually happening. Which is fine, as long as we aren’t betting our own or others fortunes, happiness, and lives on the outcome.
On Generators
Extending Taleb's idea about generators of (essentially) random, patternless outcomes, we can say that generators come in three varieties, depending on their degree of visibility/intelligibility to us. How tricked we are by them into making up reductive stories depends on their visibility to us.
Visible Generators - generators where the potential values and their frequency distribution can be either fully known beforehand or ascertained by evidence. For example, each face of a six-sided die has a 1/6 chance of coming up when rolled, each face of a twenty-sided die has a 1/20 chance of coming up. If the outcomes are not equiprobable - the 6-sided die has been rigged, the 20-sided die is worn on one side - this can be discovered by repeated testing.
The generator is accessible to us, and there are no mysteries as to its range of values, or their frequency. Also, importantly, the range and frequency cannot change without our being aware of it. We have a “gears level” theoretical understanding of it, rather than a “black box,” merely empirical understanding. The methods for generation I gave above for Images 5, 7, and 8 are examples of visible generators.Partially Visible Generators - generators whose workings are partially accessible to us. While the exact workings of the generator are not known, we know some of them. As a result, we can know the (broad) range of outcomes, and their (rough) frequencies. The predictions we make based on this are not as sound as those we make for visible generators, but statistical inference and learning in this field is not hopeless and often useful. We need not base our conclusions off of a single individual either, but from many members of the same class.
Among the Partially Visible Generators I would list human behavior. Whether or not human beings have free will / are non-deterministic in some special way, their range of actions at any given time is fairly limited - they can’t fly unassisted, hold their breath for half an hour underwater, and so on. With knowledge of their environment, we can narrow the range of behaviors further, and assign a probable estimate to any particular behavior.
For example, human beings need to sleep a set number of hours per day, and usually do so while it is night. If you call any random human at 3 a.m (their local time) you’re likely to rouse them from sleep. They also need to eat regularly, and usually do so at common times - you’re most likely to find people at breakfast between 6 and 8 a.m., and eating dinner between 6 p.m. and 8 p.m.
Heredity is another partially visible generator: we know the mechanisms of inheritance and can estimate the probability of a future child's eye color being blue, or their developing sickle cell anemia, with some but not total precision. The interplay between genotype and environment in the development of phenotype further complicates estimates, but the range of values is knowable with some precision.
While the generators cannot be fully defined due to the complexity of the factors involved, judgments of range of values and frequency can be made reliable. A careful experimenter can run repeated tests on populations created by partially hidden generators, and get real information. We may never have a fully gears-level understanding of them, but we’re not dealing with opaque black boxes either, like the hidden generators.Hidden Generators - Taleb's primary concern, in Fooled by Randomness, is with the hidden generators. These are generators that supply random, noisy outcomes whose causes are fully unknown and unknowable. His primary examples, drawn from his professional life as an options trader, is financial markets. There is more behind the movement of a stock price in any given day than could be told in millions of words describing the market conditions, the mood of the traders, what they ate for breakfast that morning, which ones argued with their spouses before work, which ones were not paying attention while they entered trades into their computers, etc.
The generator being unknown, statistical inference and learning is not possible. Worse, its often delusive and destructive, as Taleb documents: the book is full of traders who, overconfident in their abilities as they rode an upward surging wave of essentially random outcomes, bet beyond their safety limit with extreme leverage and “blew up,” losing more money than they or their employer thought possible. When this happens to large groups of traders controlling vast aggregates of capital, we get financial crises.
History is another hidden generator. After the fact, we can construct plausible connections between actions and events, personalities and circumstances, that provide part of an explanation about why things happened the way they did. History may not be unknowable, but it always needs to be consumed with reflection upon how it is made - tracing a plausible, describable path through a mess of evidence - some of which was relevant to the story, others of which were left out, and some which the historian never came across. To say nothing of personal biases, animosities and friendships between historians, influence of mentors and past historians, etc.2
These generators are true black boxes - we observe their outcomes, but not the source of them. Worst of all, their range of values and the frequency distribution can change without us knowing it, even after long periods of seeming stability. Attempting to predict them, to bet on them, is folly. Consider Chad, VP of Random Foolishness, looking at the performance of his portfolio.
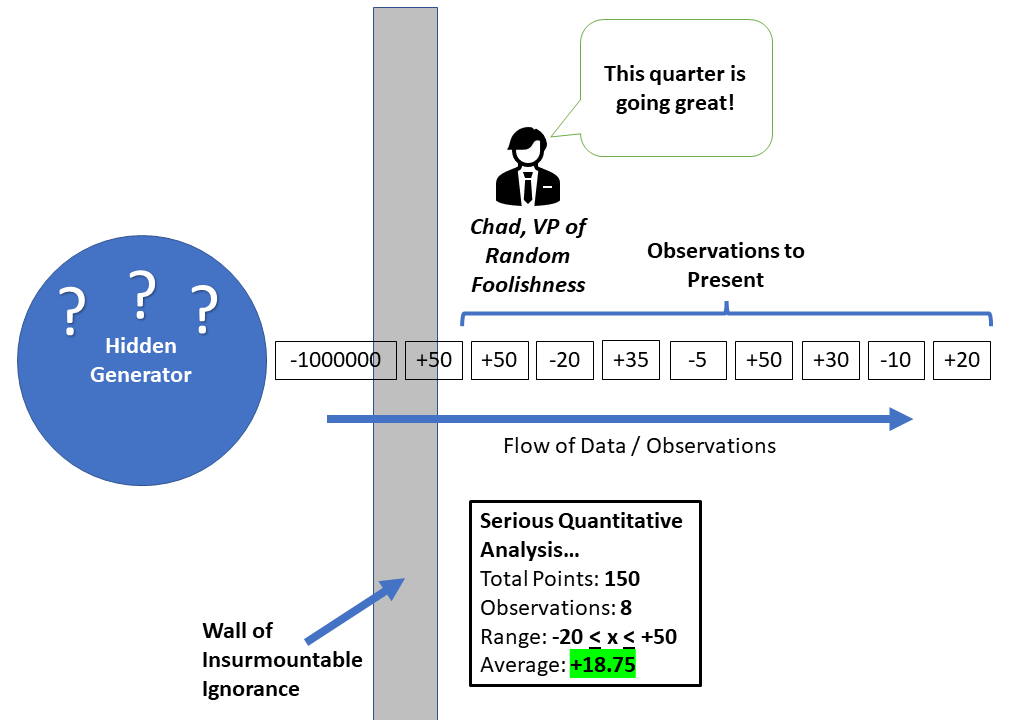
Poor Chad; he is in for a rude awakening.
Repeatedly, Taleb mentions how hard it is, in business and finance, to find people who give any thought to the unpredictable, hidden generators of the outcomes they see. People focus on the visible: the delta of the stock price over a period of days, weeks, or months; the quarterly earnings reports; the economic indicators published by governments. They don’t stop to think about the generators behind the numbers - the hundreds of thousands, millions, or billions of interactions, hidden and unmeasurable, that produce the outcomes they are seeing.
As another aside, we can make visible and partially Visible Generators into hidden Generators, black boxes, by looking at only short time slices of their behavior. Watching a hand rolling a six-sided dice once, when we cannot examine the dice ourselves, or observing an unknown person catch a bus at 3:00 p.m. headed to downtown, would be no basis to conclude anything about their behavior, how typical or atypical it was for them, and the reasons for it.
This is why I am highly distrustful of first impressions: almost all of my oldest friends - even my wife - are people I was indifferent if not mildly annoyed at when I first met them.3 In no case do I have a long term friend whom I liked immediately from the first day I talked to them. Only after repeated encounters did I grow to like them. That being said, I have limits: someone I meet for the first time waving a knife around on the bus, covered in their own (or - worse? - someone else’s) urine, and screaming about lizard people, is unlikely to be someone I would value knowing in future.4 Like Taleb, rather than seeking the absolute best outcome, I prefer to be protected against the very worst.
To think of this: think of a set of 100 stock traders, each of whom has orders to buy and sell a Stock A at set prices. None have the exact same thresholds for buy/sell. Each holds, at the start, an equal amount of shares of Stock A, perhaps. Depending on the order in which they act, in which they put their buy and sell orders into the stock market, the stock can move in wildly different directions.
The unknowability of future history, versus how it appears in retrospect, is one of the explanation for armies that fight ‘hopeless’ wars. In retrospect, Japan seems doomed when it attacked the U.S. Pacific Fleet at Pearl Harbor. In prospect, the odds were long, but victory - or a negotiated settlement of Japan and the United States’ spheres of influence - was not impossible. But the path from the decision to attack Pearl Harbor is full of so many, many variables, chance coincidences, bullets or bombs or torpedoes that hit their targets or failed, that the final outcome in our world has to be considered probable, but still the product of chance.
This may say more about my poor judgment and general moodiness when I was a younger man. I like to think I have mellowed out now, as I have more positive first impressions than negative.
Incidentally, most of the stigma around mental illnesses is that the sufferer is opaque to our predictions. Their range of possible behaviors, and their possible reactions to common events, is far off of the normal range we expect from ourselves and others.
I’m referring here to severe mental illnesses like schizophrenia and borderline personality disorder, not to clinical depression. The very sad are quite predictable. The delusional are not, and this makes them disturbing to be around.